How Owning a Home Grows Your Wealth with Time [INFOGRAPHIC]

How Owning a Home Grows Your Wealth with Time [INFOGRAPHIC] Simplifying The Market

Some Highlights

  • If you’re thinking of buying a home this year, be sure to factor in the long-term benefits of homeownership.
  • Over time, homeownership allows you to build equity. On average, nationwide home prices appreciated by 290.2% over the last 32 years.
  • That means your net worth can grow significantly in the long term when you own a home. Reach out to a real estate professional so you can start your homebuying journey today.

Why Buying or Selling a Home Helps the Economy and Your Community

Why Buying or Selling a Home Helps the Economy and Your Community Simplifying The Market

If you’re thinking about buying or selling a house, it’s important to know that it doesn’t just affect your life, but also your community.

The National Association of Realtors (NAR) releases a report every year to show how much economic activity is generated by home sales. The chart below illustrates that impact:

As the visual shows, when a house is sold, it can make a big difference in the local economy. The impact comes largely from the workers required to build, update, and buy and sell homes. Robert Dietz, Chief Economist at the National Association of Home Builders (NAHB), explains how the housing industry adds jobs to a community:

The economic impact means housing is a significant job creator. In fact, for every single-family home built, enough economic activity is generated to sustain three full-time jobs for a year, per NAHB research. . . . And one job for every $100,000 in remodeling spending.” 

Housing being a major job creator makes sense when you consider there are many different industries involved in the process. A recent article from Fortune notes housing activity could have a more robust impact than you think due to the many ways it’s tied to the economy:

“Housing has three direct linkages to economic activity (GDP): the construction of new homes, the remodeling of existing homes, and that of housing transactions. . . . consider the activity associated with home sales – think broker fees, lawyers, etc. – which are a sizable contributor to housing’s GDP footprint. 

When you buy or sell a home, you work with a team of professionals, including contractors, specialists, lawyers, and city officials. Each person plays a role in making the transaction happen. 

So, when you make a move in the housing market, you’re not just meeting your own needs, you’re also making a positive impact on the community. Knowing this can give you a sense of empowerment as you make your decision this year.

Bottom Line

Each and every home sale is important for the local economy. If you’re ready to move, reach out to a trusted real estate agent. It won’t just change your life – it’ll also have a strong positive effect on the whole community.

A Drop in Equity Doesn’t Mean Low Equity

A Drop in Equity Doesn’t Mean Low Equity Simplifying The Market

You may see media coverage talking about a drop in homeowner equity. What’s important to understand is that equity is tied closely to home values. So, when home prices appreciate, you can expect equity to grow. And when home prices decline, equity does too. Here’s how this has played out recently. 

Home prices rose rapidly during the ‘unicorn’ years. That gave homeowners a considerable equity boost. But those ‘unicorn’ years couldn’t last forever. The market had to moderate at some point, and that’s what we saw last fall and winter. 

As home prices dropped slightly in the back half of 2022, equity was impacted. Based on the most recent report from CoreLogic, there was a 0.7% dip in homeowner equity over the last year. However, the headlines reporting on that change aren’t painting the whole picture. The reality is, while home price depreciation during the second half of last year caused equity to drop, the data shows homeowners still have near record amounts of equity

The graph below helps illustrate this point by looking at the total amount of tappable equity in this country going all the way back to 2005. Tappable equity is the amount of equity available for homeowners to access before hitting a maximum 80% loan-to-value ratio (LTV). As the data shows, there was a significant equity boost during the ‘unicorn’ years as home prices rapidly appreciated (see the pink in the graph below).

But here’s what’s key to realize – even though there’s been a small dip, total homeowner equity is still much higher than it was before the ‘unicorn’ years.

And there’s more good news. Recent home price reports show the worst home price declines are behind us, and prices have started to go up again. As Selma Hepp, Chief Economist at CoreLogic, explains:

“Home equity trends closely follow home price changes. As a result, while the average amount of equity declined from a year ago, it increased from the fourth quarter of 2022, as monthly home prices growth accelerated in early 2023.” 

The last part of that quote is particularly important and is the piece of the puzzle the news is leaving out. To further emphasize the positive turn we’re already seeing, experts say home prices are forecast to appreciate at a more normal rate over the next year. In the same report, Hepp puts it this way:

The average U.S. homeowner now has more than $274,000 in equity – up significantly from $182,000 before the pandemic. Also, while homeowners in some areas of the country who bought a property last spring have no equity as a result of price losses, forecasted home price appreciation over the next year should help many borrowers regain some of that lost equity.”

And even though Odeta Kushi, Deputy Chief Economist at First American, references a slightly different number, Kushi further validates the fact that homeowners have a lot of equity right now: 

“Homeowners today have an average of $302,000 in equity in their homes.”

That means if you’ve owned your home for a few years, you likely still have way more equity than you did before the ‘unicorn’ years. And if you’ve owned your home for a year or less, the forecast for more typical price appreciation over the next year should mean your equity is already on the way back up.

Bottom Line

Context is everything when looking at headlines. While homeowner equity dropped some from last year, it’s still near all-time highs. Reach out to a trusted real estate professional so you can get the answers you deserve from an expert who’s there to help as you plan your move this year.

Your Needs Matter More Than Today’s Mortgage Rates

Your Needs Matter More Than Today’s Mortgage Rates Simplifying The Market

If you’re thinking about selling your house right now, chances are it’s because something in your life has changed. And, while things like mortgage rates are a key part of your decision on what you’ll buy next, it’s important to not lose sight of the reason you want to make a change in the first place.

It’s true mortgage rates have climbed from the record lows we saw in recent years, and that has an impact on affordability. With rates where they are right now, some homeowners are deciding they’ll wait to sell because they don’t want to move and have a higher mortgage rate on their next home. As Danielle Hale, Chief Economist at Realtor.com, explains:

“. . . homeowners who locked in a 30-year fixed rate in the 2-3% range don’t necessarily want to give that up in exchange for a rate in the 6-7% range.”

But your lifestyle and your changing needs should matter more. Here are a few of the most common reasons people choose to sell today. Any one of these may be more important than keeping your current mortgage rate.

As Ali Wolf, Chief Economist at Zonda, says in a recent tweet:

“First-time and move-up buyers are both active . . . the latter driven by life changes. Divorce, marriage, new higher paid job, and existing home unsuitable all referenced.” 

Relocation

Some of the things that can motivate a move to a new area include changing jobs, a desire to be closer to friends and loved ones, wanting to live in a dream location, or just looking for a change in scenery. 

For example, if you live in suburbia and just landed your dream job in NYC, you may be thinking about selling your current home and moving to the city for work. 

Upgrading

Many homeowners decide to sell to move into a larger home. This is especially common when there’s a need for more room to entertain, a home office or gym, or additional bedrooms to accommodate a growing number of loved ones.

For example, if you’re living in a condo and decide it’s time to seek out a home with more space, or if your household is growing, it may be time to find a home that better fits those needs. 

Downsizing

With inflation driving up everyday expenses, homeowners may also decide to sell to reduce maintenance and costs. Or, they may sell because someone’s moved out of the home recently and there’s now more space than needed. It could also be that they’ve recently retired or are ready for a change.

For example, you’ve just kicked off your retirement and you want to move to somewhere you can enjoy the warm weather and have less house to maintain. Your new lifestyle may be better suited for a different home. 

Change in Relationship Status

Divorce, separation, or marriage are other common reasons individuals sell to buy different homes.

For example, if you’ve recently separated, it may be difficult to still live under one roof. Selling and downsizing may be better options.

Health Concerns

If a homeowner faces mobility challenges or health issues that require specific living arrangements or modifications, they might sell their current home to find one that works better for them.

For example, you may be looking to sell your home and use the proceeds to help pay for a unit in an assisted-living facility. 

With higher mortgage rates, there are some affordability challenges right now – but your needs and your lifestyle matter too. As a recent article from Bankrate says: 

“Deciding whether it’s the right time to sell your home is a very personal decision. There are numerous important questions to consider, both financial and lifestyle-based, before putting your home on the market. . . . Your future plans and goals should be a significant part of the equation . . .

Bottom Line

If you’re ready to sell your house so you can make a move, connect with a real estate professional. That way you have an expert on your side to help you navigate the process and find a home that can deliver on what you’re looking for. 
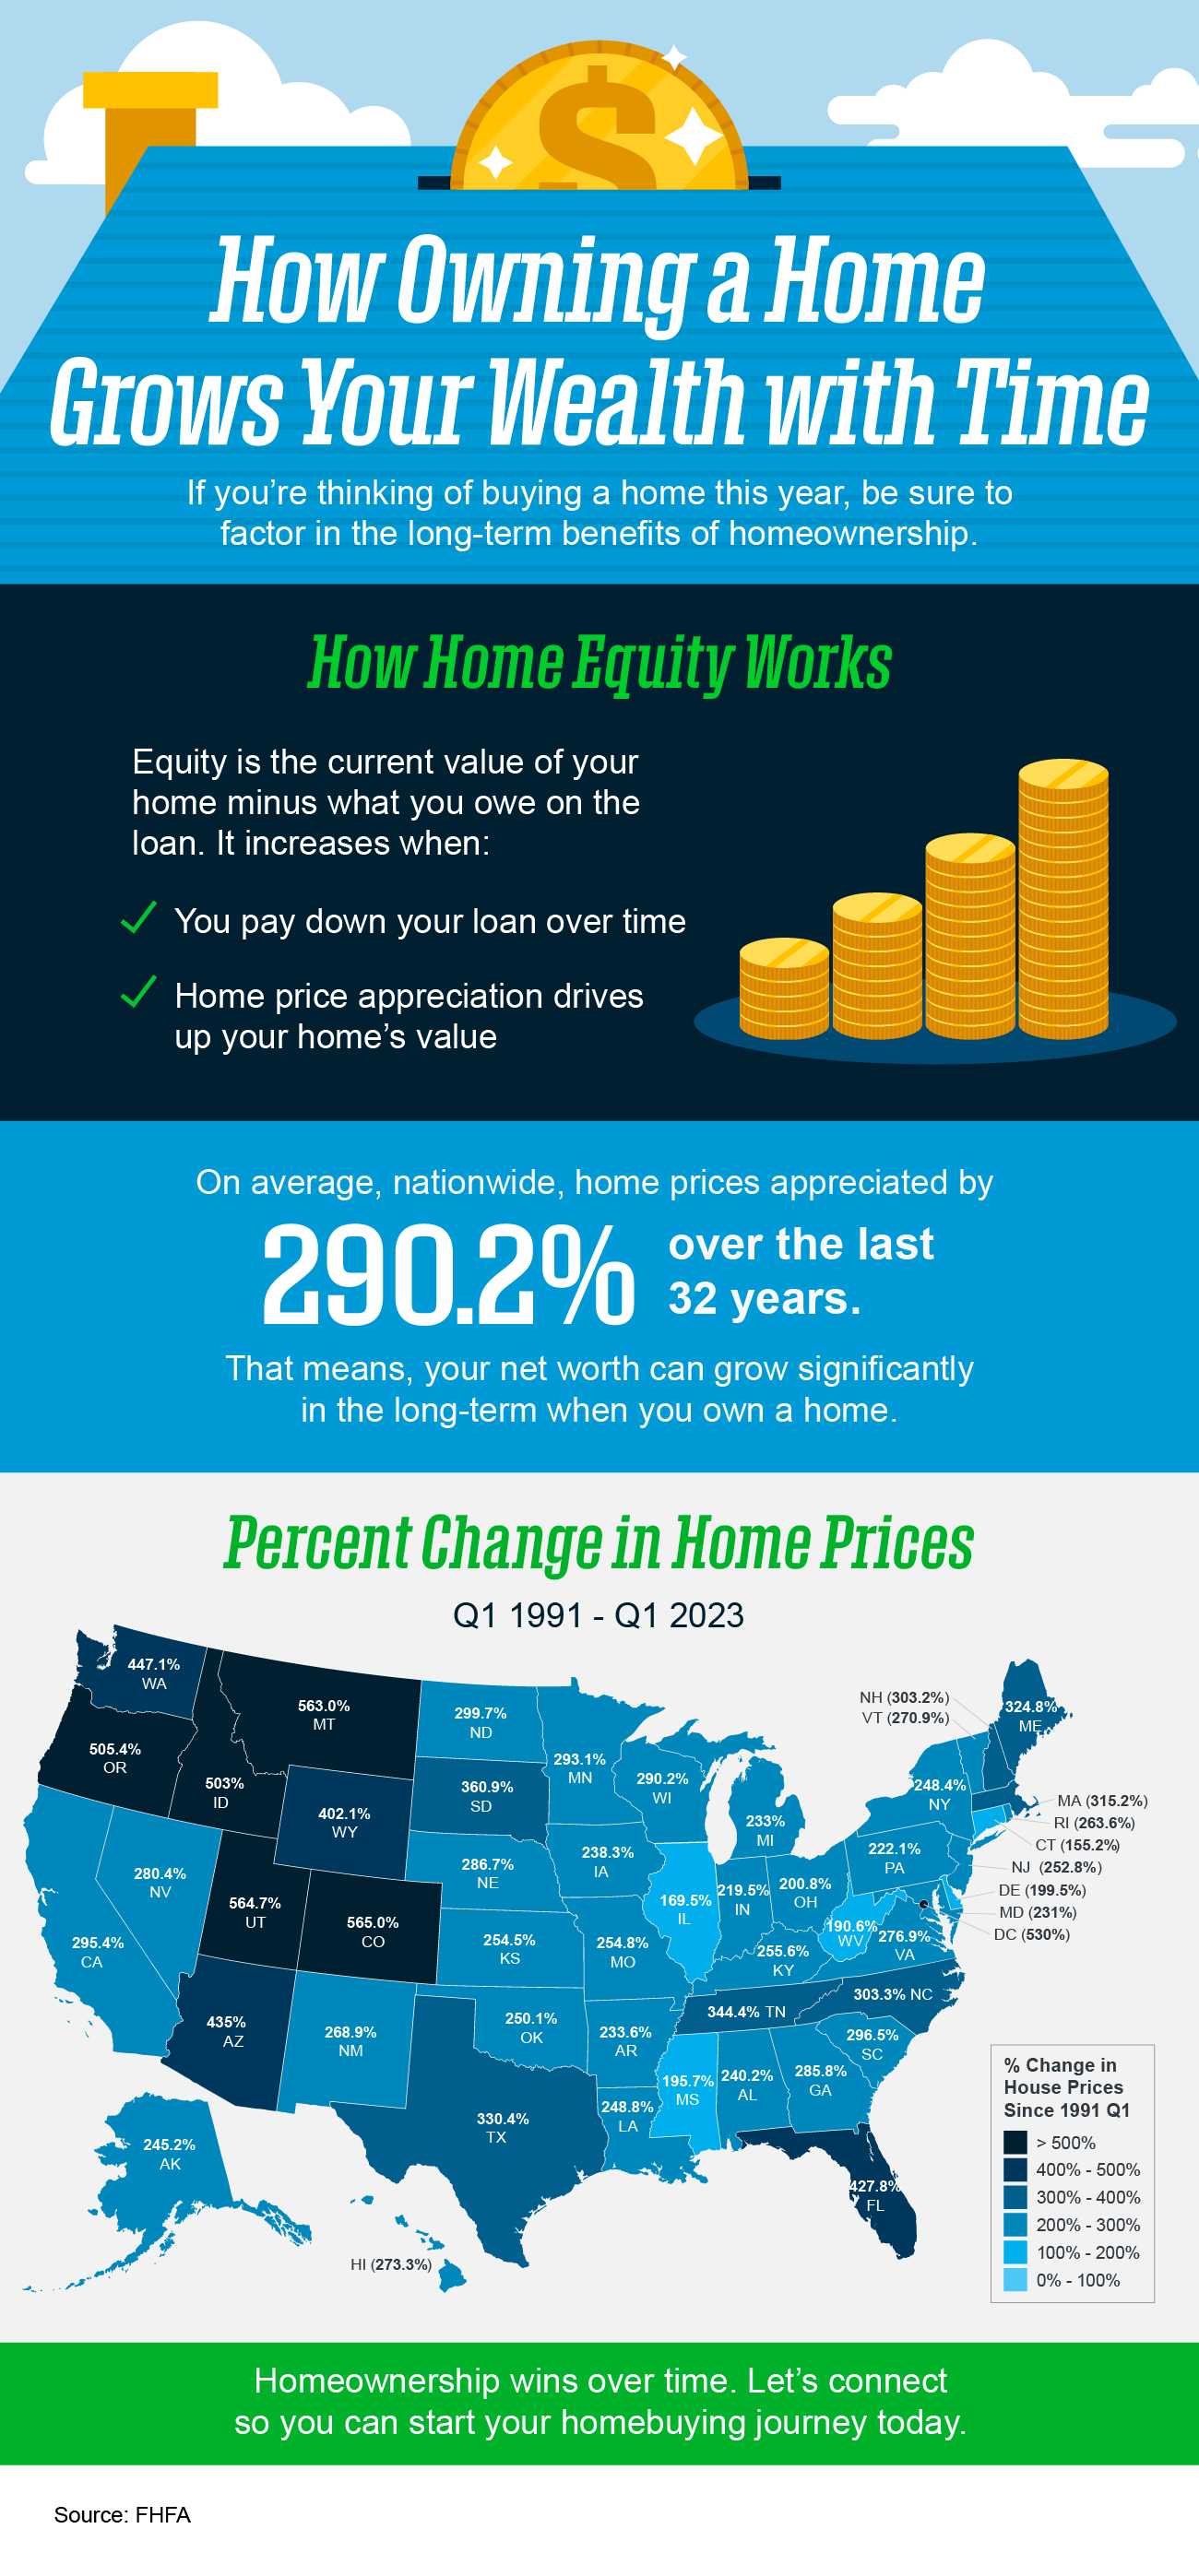
Are Home Prices Going Up or Down? That Depends…

Are Home Prices Going Up or Down? That Depends… Simplifying The Market

Media coverage about what’s happening with home prices can be confusing. A large part of that is due to the type of data being used and what they’re choosing to draw attention to. For home prices, there are two different methods used to compare home prices over different time periods: year-over-year (Y-O-Y) and month-over-month (M-O-M). Here’s an explanation of each. 

Year-over-Year (Y-O-Y):
  • This comparison measures the change in home prices from the same month or quarter in the previous year. For example, if you’re comparing Y-O-Y home prices for April 2023, you would compare them to the home prices for April 2022.
  • Y-O-Y comparisons focus on changes over a one-year period, providing a more comprehensive view of long-term trends. They are usually useful for evaluating annual growth rates and determining if the market is generally appreciating or depreciating.
Month-over-Month (M-O-M):
  • This comparison measures the change in home prices from one month to the next. For instance, if you’re comparing M-O-M home prices for April 2023, you would compare them to the home prices for March 2023.
  • Meanwhile, M-O-M comparisons analyze changes within a single month, giving a more immediate snapshot of short-term movements and price fluctuations. They are often used to track immediate shifts in demand and supply, seasonal trends, or the impact of specific events on the housing market.

The key difference between Y-O-Y and M-O-M comparisons lies in the time frame being assessed. Both approaches have their own merits and serve different purposes depending on the specific analysis required.

Why Is This Distinction So Important Right Now? 

We’re about to enter a few months when home prices could possibly be lower than they were the same month last year. April, May, and June of 2022 were three of the best months for home prices in the history of the American housing market. Those same months this year might not measure up. That means, the Y-O-Y comparison will probably show values are depreciating. The numbers for April seem to suggest that’s what we’ll see in the months ahead (see graph below):

That’ll generate troubling headlines that say home values are falling. That’ll be accurate on a Y-O-Y basis. And, those headlines will lead many consumers to believe that home values are currently cascading downward.

However, on a closer look at M-O-M home prices, we can see prices have actually been appreciating for the last several months. Those M-O-M numbers more accurately reflect what’s truly happening with home values: after several months of depreciation, it appears we’ve hit bottom and are bouncing back.

Here’s an example of M-O-M home price movements for the last 16 months from the CoreLogic Home Price Insights report (see graph below):

Why Does This Matter to You?

So, if you’re hearing negative headlines about home prices, remember they may not be painting the full picture. For the next few months, we’ll be comparing prices to last year’s record peak, and that may make the Y-O-Y comparison feel more negative. But, if we look at the more immediate, M-O-M trends, we can see home prices are actually on the way back up.

There’s an advantage to buying a home now. You’ll buy at a discount from last year’s price and before prices start to pick up even more momentum. It’s called “buying at the bottom,” and that’s a good thing.

Bottom Line

If you have questions about what’s happening with home prices, or if you’re ready to buy before prices climb higher, connect with a local real estate agent.

The owner of this website has made a commitment to accessibility and inclusion, please report any problems that you encounter using the contact form on this website. This site uses the WP ADA Compliance Check plugin to enhance accessibility.